翻译物理学中的高能物理导论的相关内容.Feynman diagrams are a graphical way of displaying the interactions between particles and fields.Examples are shown in Figure 2.1,referring to electronmagnetic interactions.Solid straight lines r
来源:学生作业帮助网 编辑:作业帮 时间:2024/04/28 07:24:41
翻译物理学中的高能物理导论的相关内容.Feynman diagrams are a graphical way of displaying the interactions between particles and fields.Examples are shown in Figure 2.1,referring to electronmagnetic interactions.Solid straight lines r
翻译物理学中的高能物理导论的相关内容.
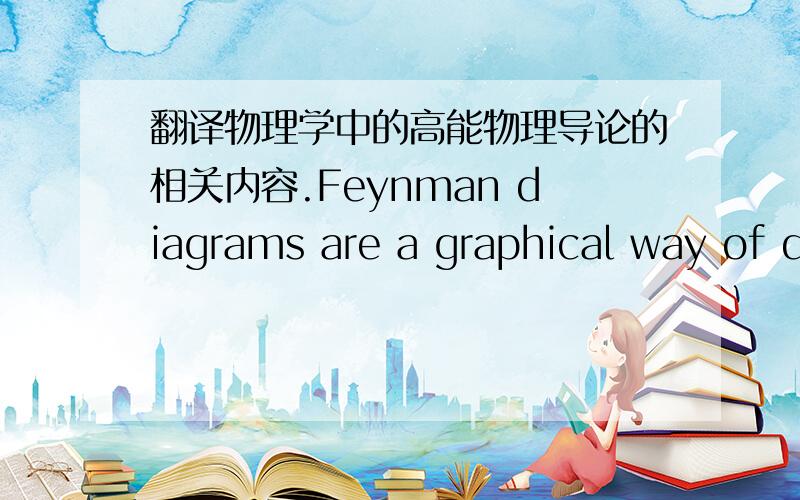
Feynman diagrams are a graphical way of displaying the interactions between particles and fields.Examples are shown in Figure 2.1,referring to electronmagnetic interactions.Solid straight lines represent fermions(electrons in the figure )while wavy ,curly or broken lines represent bosons (photons in electrogynamics).Arrows along the lines indicate the time sense,with time increasing from left to right,i.e.the arrow indicates the direction of fermion number flow.An arrow indicating motion of an electron backwards in time is equivalent to a positron moving forwards in time ;the convention for antiparticles uses such time-reversed arrows.
Fermion an boson lines meet at vertices where charge .energy and momentum are conserved,and the strength of the interaction is represented by a coupling constant (the fine structure constant a in Figure2.1 ).Lines entering or living the boundaries of a diagram represent real, or free , particles,while those joining vertices represent virtual particles. Virtual particles have energy and momentum such that the rest mass does not correspond to that of a real ,free particle.
There is a set of algebraic rules for Feynman diagrams that allows the detailed calculations of the matrix elements of interaction ,but we shall not discuss these here .The main points for our purpose are that coupling constants are involved at the vertices ,and that propogastors are associated with the virtual particles running between the vertices .We now discuss briefly the various forms of fundamental interaction in terms of these graphical representations.
请不要只使用翻译工具翻译。
翻译物理学中的高能物理导论的相关内容.Feynman diagrams are a graphical way of displaying the interactions between particles and fields.Examples are shown in Figure 2.1,referring to electronmagnetic interactions.Solid straight lines r
费曼图是一种展示粒子与场之间相互作用的图示方法.在图2.1中给出了电磁相互作用的一些例子.直实线代表费米子(图中的电子),而波浪、旋涡或虚线代表玻色子(电气学中的光子).沿着线条的箭头显示时间概念,从左向右 时间增加,即箭头显示费米子数量流的方向.显示负电子在时间上向后运动的箭头等价于正电子在时间上向前运动;关于反粒子 采用这样的时间反向箭头的习惯约定.
费米子线与玻色子线在电荷、能量以及动量守恒的顶点相交,而相互作用的强度用耦合常数来表征(图2.1中精细结构常数).进入边界或者在边界附近的线条代表真实的或者自由的粒子,而与顶点相连的线条代表虚粒子.虚粒子具有能量和动量,以便其静质量与真实、自由粒子的静质量不同.
以上就是一套费曼图的代数规则,它保证了相互作用矩阵元的细致计算.但是我们在这里不进行讨论.我们的主要目的在于指出 耦合常数被包含在顶点当中,以及媒介子与在各顶点之间运动的虚粒子相关联.现在我们利用这些图形表征法来简要讨论基本相互作用的各种不同形式.